Interactive Mapping of Archaeological Sites in Victoria
Anna Esther Heckadon et al. are 4th year Anthropology students at the University of Victoria. ORCID ID: 0000-0001-6586-9274
Received 2017-02-08
Citation: Heckadon, A. E, K. Sparks, K. Hartemink, Y. van Muijlwijk, M. Chater, T. Nicole. 2018. "Interactive Mapping of Archaeological Sites in Victoria". Epoiesen. http://dx.doi.org/10.22215/epoiesen/2018.2

Introduction
“Bridging Victoria: Stories from the Archaeological Past” was a collaborative, pop-up exhibit produced by the Anthropology Department at the University of Victoria and the Royal British Columbia Museum on November 25th, 2017. In this essay we report on the creative design issues we encountered as we made this exhibit. The overall motivation for this exhibit was public archaeology; it sought to immerse the community in local archaeology by telling diverse stories and illustrating the need for preservation of historical artifacts (i.e. post-1846 artifacts not protected by law in British Columbia).
The exhibit brought together two UVic Anthropology courses, our 4th year digital archaeology course and a 3rd year heritage course. The students in the heritage course were responsible for researching and interpreting three local collections to develop creative and engaging narratives about the past. The students in our digital archaeology course split into groups to create digital resources to facilitate or enhance those narratives. As a group, we decided to create a physical interactive map contextualizing the three archaeological sites in Victoria. We designed it to allow community members to explore and discover the stories of Victoria’s past through a hands-on experience.
To learn more about the stories told at our pop-up exhibit please visit our playlist on the Royal BC Museum website: http://learning.royalbcmuseum.bc.ca/playlist/bridging-victoria/.
To learn more about the behind the scenes and the making of our stories, please visit: http://learning.royalbcmuseum.bc.ca/playlist/bridging-victoria-experiencing-the-exhibit/.
Making the Map
The map was designed to fill a need for an introduction to the three sites in the lobby of the museum before visitors explored the main collections spaces upstairs to participate in the rest of the pop-up exhibit. Our goal was to create a physical map that was engaging to the audience, encouraged curiosity and independent exploration, and set the tone for the participatory nature of the event.
We were inspired by a guest lecture by Beth Compton (a PhD student at the University of Western Ontario and co-founder of the DH MakerBus) on maker culture and electronic components like conductive tape, Makey Makey, and so on. These maker components are flexible, cost effective and can easily be dismantled and repurposed in a range of applications, which makes their use in heritage and archaeology particularly appealing. In this case, we utilized electrical currents and basic computer programming to trigger audio-based introductions to sites located on a map of Victoria to orient visitors and provide an introduction to archaeology. Below we explain each component of our physical digitally-enhanced map.
Design & Build
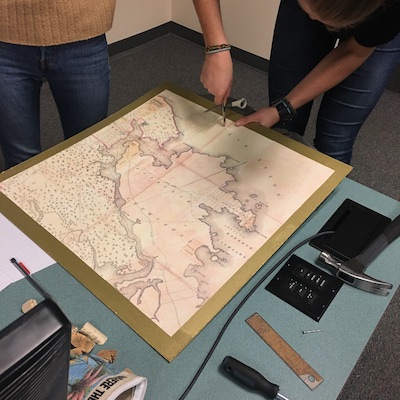
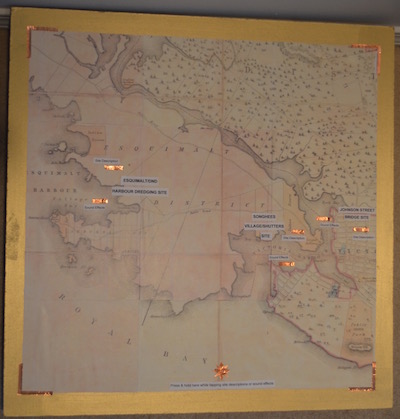
Making a physical map that was durable enough to stand up to visitor interactions, fit cohesively with the design of the pop-up and seamlessly integrated electronic components proved harder than we expected. Our approach was creative, and largely based in trial-and-error and make-do and mend, given our limited budget and timeline (both common realities in the heritage sector). Our initial plan was to paint the map of Victoria onto the board but eventually we settled on printing the map in colour scaled to the size of the foundation board. We sourced the image of the map from the Royal BC Museum online archives, to be cohesive with other design elements of the exhibit.
Next, we punctured the board to feed the conductive tape through, creating the touch points in relevant parts of the map. We made two holes per archaeological site, so that we could have a site description as well as a soundscape, and one at the front for our “Earth” button (see Makey Makey & Scratch section below). To make sure that our electronic components had enough room underneath the map, we elevated the board by gluing wooden dowels to each corner.
Audio
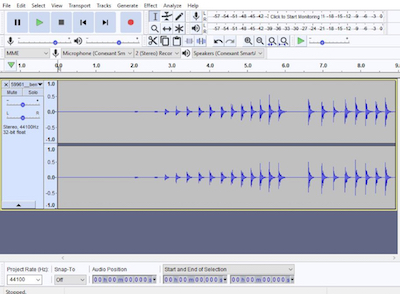
We used Audacity, a free and open source audio software, to edit and compile the sound files for our map. We recorded short descriptions about each site and some sounds, but we also drew on sound files used in another generous group’s narrative soundscape project.
Writing the summaries about each individual site was difficult because these sites were excavated in advance of construction by volunteers or private firms and remain largely unpublished. Using grey literature and the research from the third-year course we were partnered with, we critically reflected on what audiences needed to know, what was realistic and manageable, and what was useful in understanding the rest of the pop-up exhibit.
3D Objects & Printing
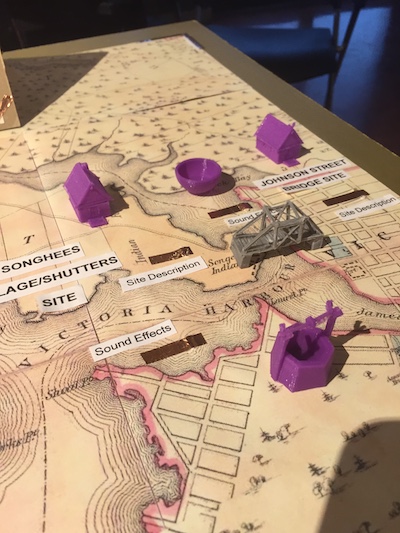
The map included printed 3D 'artifacts' for interactivity on the board.
Because time did not allow for the modelling of artifacts from this collection (particularly given that the context of an in-class project does not allow for the time needed for proper consultation with descendant communities), we drew on existing models (mainly from Thingiverse) that were similar to artifacts and landscapes of the three sites.
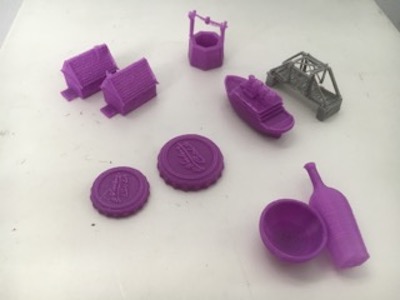
For the Songhees Village/Shutters archaeological site, we chose not to include 3D prints of Indigenous artifacts, because of the difficulty ascertaining whether they were modelled and shared with appropriate consultation and permissions. Instead, we chose to print features of the landscape, including a well (from which many of the objects in the exhibit were excavated) and houses similar to what can be seen in archival photos.
For the Esquimalt Harbour site, bottle caps found in the harbour were printed as well as a boat, as this site has been used as a naval base since 1842. This is complemented by the soundscapes, in which bottle caps opening can be heard and the site description discusses naval history.
For the Johnson Street Bridge site, excavated in advance of new bridge construction, a model bridge from Thingiverse was adapted to mirror the swing bridge that existed at the site from 1888 to 1923 (the same period from which many of the artifacts date). The archaeological collection is representative of early Chinatown history, and so we also printed a rice bowl and glass bottle representative of the commercial and domestic context of this area. In the soundscape for this site you can hear the clinking of bottles and china to match the 3D prints.
Makey Makey & Scratch
To bring together the physical map board with the digital audio files, our goal was to have visitors trigger audio relating to each site by touching corresponding places on the map. We achieved this using Makey Makey, Scratch, and conductive tape.
Makey Makey is an electronic kit that plugs into computers by way of a USB cable and acts like a keyboard. Scratch is a website where you can easily “program your own interactive stories, games, and animations -- and share your creations with others in the online community.” (For more on Scratch, see their about page.) Conductive tape is an adhesive tape that creates and completes circuits. Used together, the three components allowed visitors to trigger the audio guides by touching relevant places on the map.
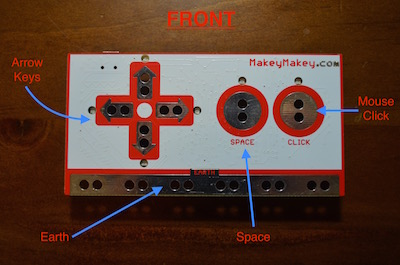
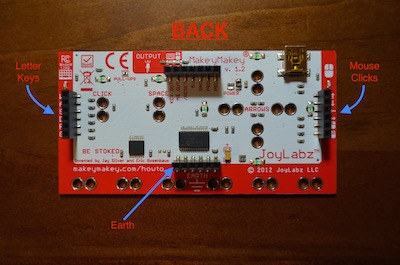
Here is what the Makey Makey board looks like. On the front side you have: Space, (Mouse) Click, Right/Left and Up/Down arrows, and on the back you have various letter keys and different mouse clicks. The bottom row has “Earth.” When plugged into your computer with a text editor open, pressing certain letter keys on the board will type that key into the text editor on screen, which looks something like this:
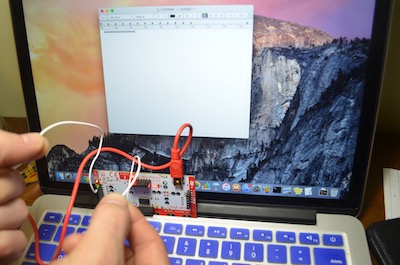
Here the letter “w” is being pressed and thus appearing on screen. One does this by holding a wire connected to “Earth” (right hand in image) on the board and by tapping a wire connected to the “w” output (left hand) -- effectively completing the electrical circuit.
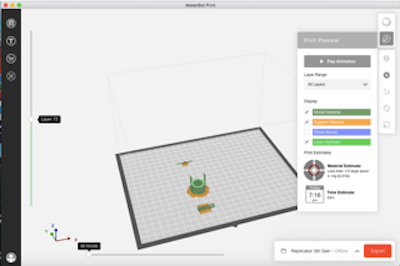
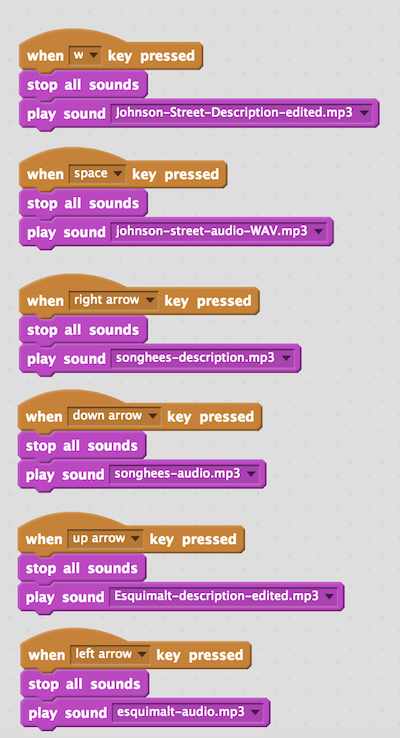
Our plan was to have Makey Makey connect the Scratch program on the computer, so that when certain keys on Makey Makey were pressed audio would play. On Scratch, we created a program saying, “if SPACE key pressed, PLAY AUDIO.” Below is an image of the final product of our Scratch program.
We attached the Makey Makey board wires to the conductive tape so users would not have to touch the wires directly, but rather a more user friendly, aesthetically pleasing map with conductive tape acting as “buttons.”
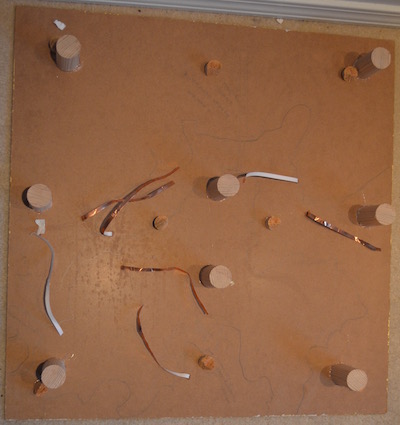
The conductive tape was placed through the holes we made in the board. We did it in this way so that the tape could be pressed on the top of the board, yet attached to the wires underneath.
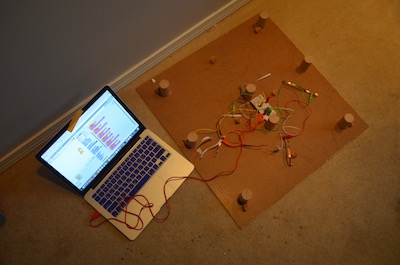
Above is an image of the underside of our board connected to Makey Makey and connected to the computer. Each wire is connected to its corresponding place on the Makey Makey board according to which letter needs to be pressed as stated on the Scratch program.
We had wanted to connect lights to each of the sites on the board so that people could press a piece of conductive tape in a map legend to light up the corresponding site.
For the lights we first tried using the Makey Makey board, as described in this video. However, we discovered that there are only two outputs on the Makey Makey board, but we needed three lights (one for each site). After some thinking and testing on whether we could successfully connect multiple lights to one output, our professor, Dr. Katherine Cook, suggested we try button batteries (image below).
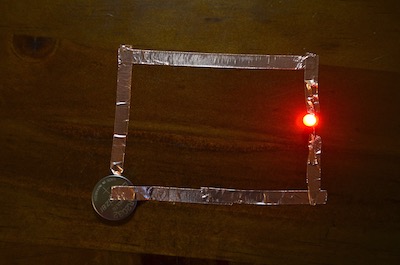
We tested these button batteries but unfortunately they were so finicky that we decided against committing to making holes in our board for something that we feared would not reliably work on the day of the exhibit. Therefore, we decided to stick to just using Makey Makey, Scratch, and conductive tape for site descriptions and sound effects.
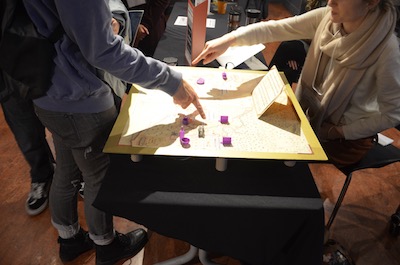
Using the Map
People seemed surprised and pleased every time they touched the map and something happened. It was great to see people so interested in learning about the sites and listening to all of the sounds at each of the sites. People were excited each time their actions triggered sounds, and had lots of questions as to how we made this possible.
At the same time, it was sometimes a little confusing for users to learn how to make a sound happen. To do this, you had to touch one finger to the “Earth” strip, and another finger to any other strip on the board and then let go. Some people held without letting go or did not touch both strips at the same time, but after a quick explanation everyone understood how to make it work. The other unexpected problem was an acoustic one; the level of buzz and chatter at the event was fantastic but it made some of our sounds hard to hear. In the future, we would plan to have a louder speaker, headphones, or a room to ourselves so people could hear our map better.
The 3D printed objects on the map also proved popular, especially for the children who came. The children really enjoyed playing with the 3D printed objects and moving them around the map while their parents listened to our site descriptions and soundscapes. Their interaction also reminded us of how generational even recent historical objects are as many children seemed confused about the bottle caps and the sound of a cola bottle opening!
Maker tools were an incredible addition to our project. They helped make our project interactive, educational, hands on, and fun for both adults and children. With further development and problem solving, we think that these tools are definitely applicable to heritage and heritage projects. They make building interactive exhibit components fast, are reasonably low friction, and relatively cheap for heritage budgets and timelines.
Acknowledgements
We would like to thank our wonderful Dr. Katherine Cook for her expert teaching, for planning the pop-up exhibit with the Royal BC Museum, and for her encouragement and assistance with our project.
We would also like to thank Beth Compton who, with her guest lecture, inspired us to create this map, and for serving as our making mentor.
We would like to thank Dr. Genevieve Hill, Chris O’Connor, and the Royal BC Museum for facilitating the research/pop-up event.
Additionally, thanks to Shawn Graham for noticing our project and for his support and feedback.
Cover Image courtesy of the Authors
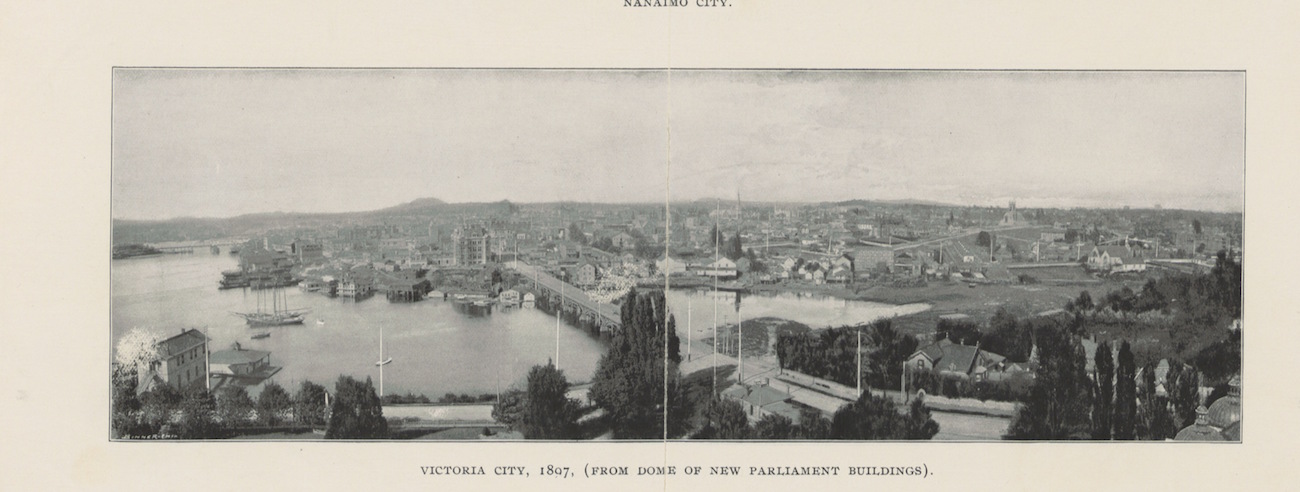
Masthead Image "Victoria City, 1807, (From Dome of New Parliament Buildings). Image taken from page 25 of '(The Year Book of British Columbia Compendium.) Compiled from the Year Book of British Columbia ... To which is added a chapter ... respecting the Canadian Yukon and Northern territory generally'" British Library